
FINANCE & DATA ANALYTICS

Charles
Xiao.

XIAO Yao Hong Kong

Financial thinking. Analytical depth.

I work at the intersection of finance, data and business — from financial-data workflows and private banking research to ESG portfolio optimization.

Charles Xiao wearing glasses and a dark suit
Charles Xiao

Finance · Research · Analytics

A little more about me
THE WAY I WORK

Understand the question. Work carefully with the data. Make the findings clear.

A finance foundation, strengthened by hands-on experience in Python, investment research and cross-functional delivery.

04

Internship experiences

Data, banking, investment & marketing

20 years

U.S. equity data

Used in the course portfolio project

07

Countries researched

For private-banking analysis at ICBC

01 / EXPERIENCE

Real work. Broader perspectives.

Four internships spanning financial data, private banking, investment and digital marketing.

2025Jun – Jul 2025EAST MONEY

East Money

Business Implementation Intern

Data Platform Department · AI Division

Building reliable financial-data workflows, from requirements to delivery.

Python & JavaScriptData workflowsJIRA
Responsibilities & outcomes
  • Translated stakeholder requirements into actionable JIRA tasks and implementation plans, coordinating upstream and downstream teams through delivery.
  • Developed and debugged collection, cleansing, transformation and deployment workflows; used Python and JavaScript analysis to adapt extraction to anti-scraping mechanisms and Excel-formatted data embedded in HTML.
  • Monitored pipeline alerts and repaired extraction and parsing failures caused by source changes to maintain data continuity, accuracy and reliability.

2024Jul – Aug 2024ICBC

ICBC · Private Banking Head Office

Ultra-High-Net-Worth Client Department Intern

Private banking · Research & client development

Cross-market banking research and structured analysis for charitable-trust development.

7 countries researched560 records screenedPrivate banking
Responsibilities & outcomes
  • Researched leading banks across seven countries using annual reports and public disclosures; produced a 23,046-character comparison of financial performance, marketing practices and private-banking client acquisition.
  • Edited and subtitled charitable-trust training videos and refined visual materials for an internal rollout covering 1,068 employees.
  • Analyzed major-donor activity from 2020–2024 and screened 560 donor and prospective settlor records, creating a structured base for prospect identification and charitable-trust projects.
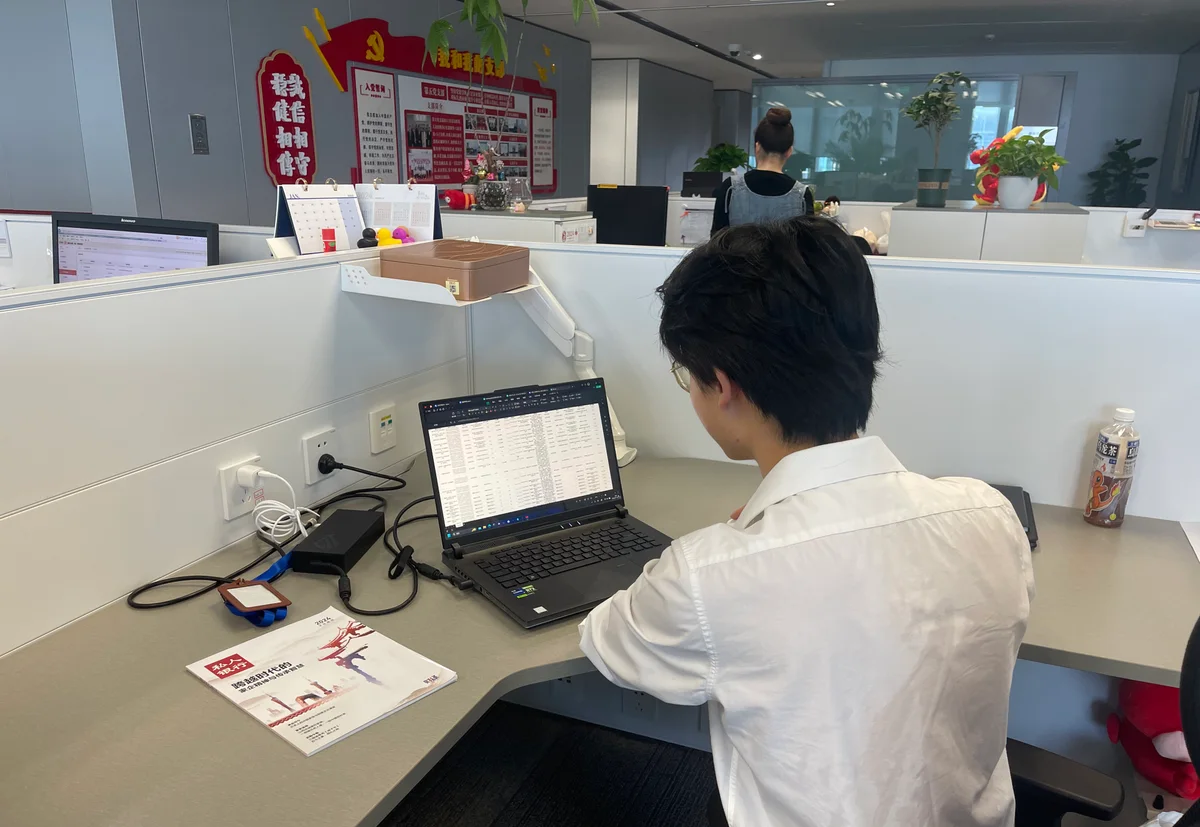
MOMENTS AT ICBCSummer 2024
Charles working at a laptop during his ICBC internship
01At work · Private Banking
An instant photograph and lanyard from the ICBC internship, dated August 23, 2024
02An internship keepsake
2023Jun – Aug 2023SHENYA

Shanghai Shenya Investment Holding

Project Department Intern

Investment projects · Market research

Supporting investment projects with feasibility research and stakeholder coordination.

Feasibility analysisProject coordination
Responsibilities & outcomes
  • Conducted market and feasibility research, compiled proposal summaries and prepared materials for early-stage partner negotiations.
  • Coordinated meetings and external liaison; created minutes and action logs, tracked milestones and shared progress across stakeholders.
SHENYA · PROJECT DIARY
A bilingual project meeting agenda displayed on a laptop in a conference room
01Meeting agenda
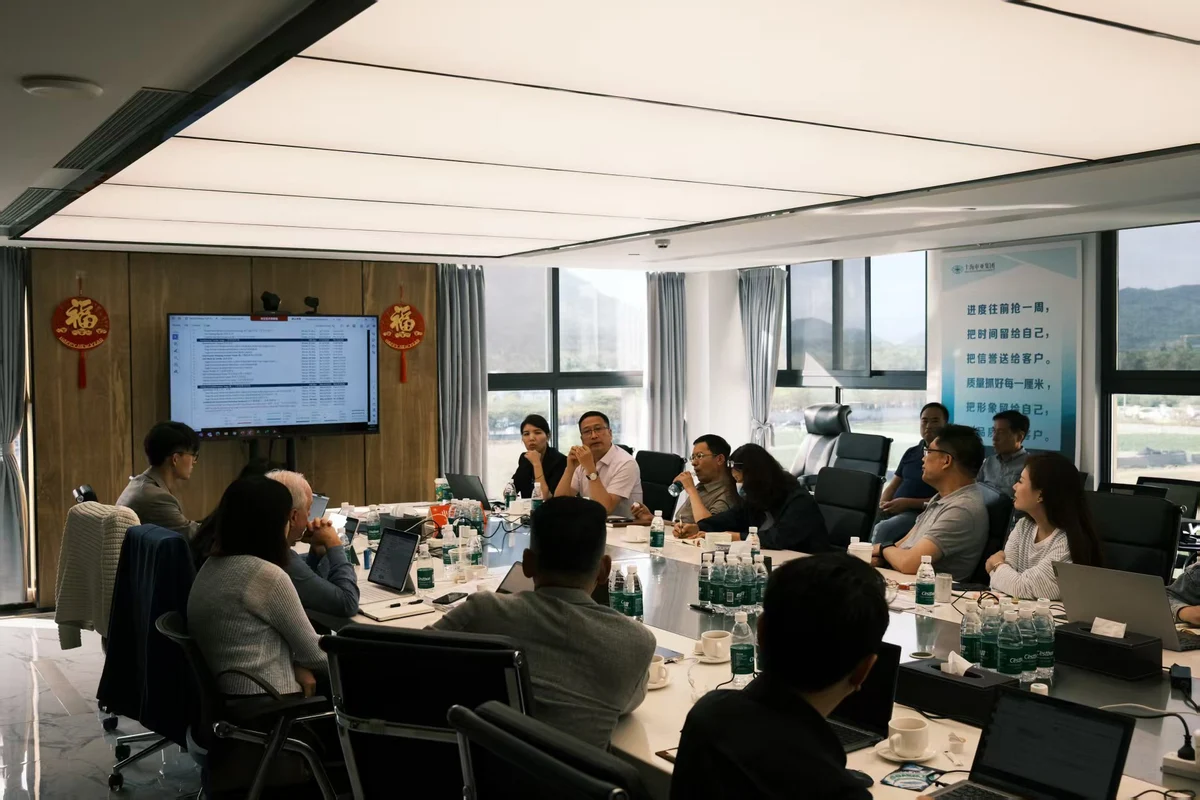
Participants discussing project materials around a conference table
02Project negotiation
2022Jun – Aug 2022USHOPAL

USHOPAL

Marketing Intern

Shanghai Shenyi Technology Co., Ltd.

Connecting content, campaign metrics and brand partnership research.

Digital marketingCompetitor research
Responsibilities & outcomes
  • Managed RedNote publishing and audience engagement, monitored campaign performance and translated metrics into optimization recommendations.
  • Supported brand bids and partnership proposals through presentation materials, competitor research and coordination across design, content and technical teams.
02 / SELECTED PROJECTS

Curiosity, put into practice.

Independent research, team leadership and a student venture.

RESEARCH PAPER

Portfolio Optimization Based on the ESG-Efficient Frontier Model

Download paperPDF · 1415 KB

Research: redrawn source frontiers · Course: source results · SmartEdu: conceptual artwork

SMARTEDU CLOUD

Recognition along the way.

2024

Bronze Award

China International College Students’ Innovation Competition · Higher Education Main Track, International Category

2024

Regional Silver Award

Chuangyi Cup National College Student Innovation & Entrepreneurship Competition

2024

Merit Award

18th iCAN Innovation Contest · Shanghai

2024

Grand Prize

Shanghai University Future Partner Business Elite Challenge

2023

Second Prize

Shanghai University Future Partner Business Elite Challenge

03 / EDUCATION

A foundation for what comes next.

Sep 2026 – Jun 2027

City University of Hong Kong

MSc Business and Data Analytics

Quantitative Analysis for Business

Expected graduation · June 2027

Sep 2021 – Jun 2026

University of Technology Sydney

Bachelor of Business in Finance

UTS Program · SILC Business School, Shanghai University

Degree awarded solely by UTS, Australia

04 / CAPABILITIES

The tools. The thinking behind them.

Quantitative methods, practical tools and clear communication.

Quantitative & data analysis

Python-based quantitative analysis, IC assessment, backtesting, return curves and Sharpe ratio analysis.

Portfolio optimizationMachine learningDecision treesWeb scraping

Research & delivery

Stakeholder requirements, business research and translating analytical results into clear presentations.

Excel & SolverPowerPointWordAnacondaPyCharm

Languages

Mandarin & ShanghaineseNative
EnglishIELTS 6.5
JapaneseIntermediate

English proficiency: upper-intermediate.

LET’S CONNECT

The next chapter starts with a conversation.

I welcome conversations about opportunities in finance, data analytics and business analysis.

xiaoyaocharles@163.com
Hong Kong
INDEPENDENT RESEARCH

ESG preferences. Quantified.

Portfolio research · May 2025 – Jun 2026

Independent researcher

Pythonθ-based optimizationRobustness analysis

The study, in STAR.

Situation

Traditional portfolio models focus on risk and return; investor ESG preferences need an explicit, measurable role.

Task

Extend MM and IM portfolio models to quantify how ESG preferences and layered constraints change financial efficiency and asset allocation.

Action

Introduced a tunable θ parameter, implemented a Python optimization workflow, and compared five preference levels across three constraint layers using frontiers and portfolio metrics.

Result

Made the trade-off measurable: Table 4 reports ESG rising from 4.99 to 5.66 as monthly return changes from 1.08% to 0.96% between C-0 and C-1.

A preference-driven optimization framework.

2Portfolio models
3Constraint layers
5ESG preference levels

θ = 0 / 0.25 / 0.50 / 0.75 / 1.00

θ controls the balance between financial and ESG objectives. MM uses a full covariance matrix; IM models market exposure and residual risk. The study evaluates return, volatility, Sharpe ratio, ESG score and portfolio weights across C-0, C-1 and C-2.

Python · CVXPYPortfolio optimizationConstraint comparison10 U.S. equities

Making the ESG trade-off visible.

The reported maximum-Sharpe portfolios show higher ESG scores alongside lower return and Sharpe ratios as the constraint layers change.

Maximum-Sharpe portfolios · Reported results
LayerMonthly returnMonthly volatilitySharpeESG score
C-0Long-only baseline1.08%4.80%0.2244.99
C-1ESG-constrained0.96%4.74%0.2035.66
C-2Additional risk controls0.90%4.60%0.1965.65

Source: Table 4, p. 9. Values reproduced as reported; return and volatility are monthly.

MM efficient frontiers under C0, C1 and C2, approximately digitized from Figure 2
MM efficient frontiers · Redrawn from p. 8
IM efficient frontiers under C0, C1 and C2, approximately digitized from Figure 2
IM efficient frontiers · Redrawn from p. 9

Redrawn by approximate digitization of Figure 2, rather than recomputed from portfolio data. Both axes show monthly percentages. Select a chart to enlarge; the PDF contains the original figures.

Download paperPDF · 1415 KB

Frontier figures redrawn from the supplied paper; reported table values are unchanged.

COURSE PROJECT · TEAM LEADER

20 years of data. Two portfolio models.

May 2025 – Jun 2026

Team leader

Excel SolverU.S. equitiesEfficient frontiers

Two models. Four constraint scenarios.

A comparison of Markowitz Mean-Variance (MM) and Single-Index (IM) portfolios, showing how short-selling, leverage and ESG constraints affect the results.

Maximum-Sharpe portfolios
ScenarioMM SharpeIM SharpeMM returnIM return
P1Long-only0.8280.82416.01%15.98%
P2Long-only + ESG0.8130.80715.09%14.86%
P3Leverage limit1.0990.98820.44%20.62%
P4Leverage limit + ESG1.0810.97419.60%20.58%

Source: Group 1 final presentation, p. 35. Returns are annualized; Sharpe ratios are reproduced as reported.

Original MM efficient-frontier comparison across four portfolio constraints
MM frontier comparison · Presentation p. 31
Original IM efficient-frontier comparison across four portfolio constraints
IM frontier comparison · Presentation p. 33

Original presentation charts. Select either figure to view it at full size.

From data to decisions.

01

Prepare the data

20 years of prices: monthly returns and excess returns for 10 U.S. stocks, with SPX as the market benchmark.

02

Build the model inputs

Estimate returns, volatility and correlations for MM; beta, alpha and residual risk for IM.

03

Optimize and compare

Use Excel Solver for minimum-variance and maximum-Sharpe portfolios, then compare constraint scenarios and frontiers.

Excel Solver parameters for maximum-Sharpe portfolio optimization from the project presentation
Model implementation · Excel Solver · p. 21

Workflow source: presentation pp. 18–21 and the supplied workbook.

Led a team using 20 years of U.S. equity data, coordinating data preparation, model construction, optimization and presentation while standardizing assumptions and validating team outputs.

Built and compared Markowitz Mean-Variance and Single-Index models in Excel Solver. Constructed efficient frontiers under short-selling, leverage and ESG constraints and interpreted their risk–return implications.

Integrated quantitative results and constraint comparisons into a final investment presentation with clear portfolio implications.

Charts and results selected from the supplied course presentation.

ENTREPRENEURSHIP · TEAM MEMBER

SmartEdu Cloud. Knowledge, connected.

Apr 2023 – May 2025

Team member · Pitch design

Business modelingProduct requirementsPitch design

Co-developed the platform and its user-acquisition model, expanding reach to students across more than 90% of schools at Shanghai University's Jiading campus.

Designed revenue streams from paid resource downloads, study-abroad referrals and peer tutoring, and supported partnerships with education providers.

Led pitch design, translated product needs into technical requirements and performance metrics, and delivered a one-minute investor summary that secured votes during a live pitch.

Project artwork is conceptual. Research results and source materials will be added separately.